News:

Follow BoincTasks on Twitter Facebook        Visit our website here.
BoincTasks cloud login is working again

Main Menu
Menu

Show posts

This section allows you to view all posts made by this member. Note that you can only see posts made in areas you currently have access to.

Show posts Menu

Topics - JStateson

#1
The Berkeley supplied "all_projects_list.xml" seems to be outdated according to Milkyway, WCG, and possibly others.

For example the typical warning request (usual 100's of them)

This project seems to have changed its URL.  When convenient, remove the project, then add http://milkyway.cs.rpi.edu/milkyway

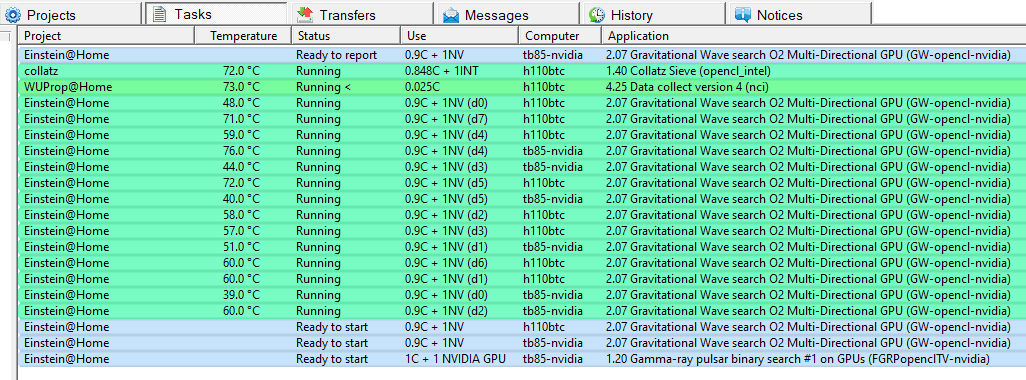
I did the requested change for several Milkyway and WCG systems and noticed that the ones I changed no longer show up when using the project selection side bar.  The projects that show the warning message are the only ones that show up in the filter. By "no longer show up" I mean the active tasks are not listed.

I edited the "all_projects_file.xml" on one of the problem systems and changed
        <url>https://milkyway.cs.rpi.edu/milkyway/</url>
        <web_url>https://milkyway.cs.rpi.edu/milkyway/</web_url>

to

        <url>http://milkyway.cs.rpi.edu/milkyway/</url>
        <web_url>http://milkyway.cs.rpi.edu/milkyway/</web_url>

but had no effect.  I assume the project sidebar is created by adding active project urls from each system in BT (I have 9) and one of the Milkyway entries has https and that one is found before the http one. Another problem I see is that the project's master url does not bother to use http even after making the required change from https to http like the project requested.

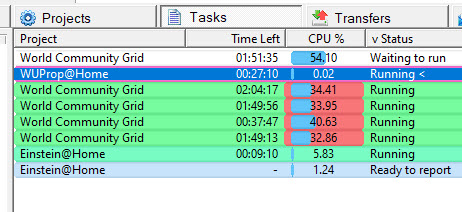
From looking at the Milkyway and WCG forum and their problems and lack of response (mainly Milkyway) I doubt if the projects is going to ask Berkeley to amend that "all_projects_list.xml" and some projects like wprop are not on the list anyway.  Wprop shows up in the project filter but the tasks are missing just like the Milkway and WCG tasks.

I am going to make a guess that if "https" and "http" are not included in the lookup the tasks will be found but that is just a guess.
#2
I have a rule that suspends the GPU for 20 seconds then issues a resume.  I use it to restart a hung task.

"c:\Program Files\Boinc\boinccmd.exe" --host h110btc  --set_gpu_mode never
cmd.exe /c timeout.exe /T 20
"c:\Program Files\Boinc\boinccmd.exe" --host h110btc  --set_gpu_mode always

The rule works fine if Boinctasks runs when Windows starts which is the normal case.
It does not work if I run Boinctasks from the desktop shortcut.  I need to specify "run as administrator" else none of the 3 lines of code do anything.

It is inconvenient to have to "run as administrator".  Possibly there is some security setting or ownership change to allow the apps to work without having to run as administrator.  I tried a number of things but they did not help.

Those lines of code are in a script ".cmd" file.  It is not necessary to "run as administrator" if I chose to run the script manually.  However, Boinctasks needs to run as administrator to have the script file work.
#3
RTX-2080 was replaced under warranty with RTX-3070 (Gigabyte did not have any more 2080)
System seems to be running well but the CPU usages for CPU bound tasks shown values under %50 that were normally %99 using the gtx-1660 or rtx-2080
I removed all processors from windows 11 then rebooted but that did not fix the problem.  The win11 resource cpu plots indicate the cpu is used a lot more than the %35
Wondering if my "free" RTX-3070 was a refurbished replacement with a problem or may the problem is the express-3 motherboard with an express-4 graphics card.

#4
I came here looking for why over the last several months my system has really slowed especially noticeable in BoincTasks "updates" but also affecting other programs.  Using windows 10 resource manager I observed disk drive C generally %100 most of the time with a very rare drop to under %5

BT is handling 7 systems and 82 apps.  It was getting difficult to even scroll BT and I had to wait 20-30 seconds to see a response. Sometimes the response was "Not Responding".  Disk usage was always showing  %100 during these times.


I used the following for ideas that worked so well I had to come here to post about it.
https://www.drivereasy.com/knowledge/100-disk-usage-windows-10-fixed/

What I did and how it worked

1.  Saw that iCloud photos was a big user, I disallowed iCloud from any access to my files.  This brought the disk usage down and a slight improvement.


2.  Went to startup services and changed sysmain from automatic to manual.  This made a huge difference in startup.  No long %100 for the first 3-4 minutes after rebooting or starting windows.  I suspect that this app informs M$OFT what programs you run most of the time in addition to pre-loading them in memory.  I don't need to have gridcoin research, BOINC or BT preloaded especially gridcoin as it is huge.

3. Change system performance from "best looking" to "adjust for best performance".  This made a huge difference in boinctasks.  Some time ago after a feature update I was asked if Windows could change my display settings to improve them.  I think this caused the shift from best performance to best looking.

4. Set virtual memory to custom:  minimum 4096 max 32768 for C drive only,  Nothing for D drive.  I have 32gb ram and the recommended was 1.5 * 32 but I went with 32 instead of 48.

It is as if I have a new computer again!!!!


hope this helps someone.
#5
If you have several systems running the same app, the BoincTasks history reader can now estimate the total number of work units per day you can complete.  This takes into account idle time between completion of work units.  You need to have minimum of 24 hours of BT history.

You will need to know the averaged credit per work unit. For some projects and apps, the amount is fixed.  For example. Einstein-at-home's Gamma Ray Pulse Binary search #1 is always 3,465 credits.  Other projects require the average be calculated.  That can be done using this web site

For example:  this url represents one of the current board leader at SETI.  If you click on that url and then select "calculate" you will see an average of about 80 credits per work units based on 20 works units.

Once you have the average credit per work units you can estimate your total throughput by running the BT history reader and selecting all the histories for each system that is running, for the example below, Einstein.  The BT reader will then show all the apps that all the systems are running.  You must then select only the apps for which you have the average credit.  A shown below, the apps for Gamma Ray Pulse Binary search #1  have been selected.  You can then click on the "SAVE" to get a listing on notepad of the number of work units per day.  That number can then be multiplied by the average credit per work unit.  A shown below the estimated credits per day would be around 14,000,000.  Due to the way projects calculate the actual daily credit, it may take 2-3 weeks at 24/7 before that value shows up.


Executables are here (there is no install, just a zip file)
https://stateson.net/BTHistory/bthistory_64_32_bins.zip
All sources are at GitHub and require VS2017
https://github.com/JStateson/Gridcoin-BoincTask-HistoryReader
The above includes the web app "HostProjectStats" sources.
#6
Questions / Need clarification on interface messages
January 31, 2020, 09:05:48 PM
I ran into a problem when receiving temperatures when multiple manufacture video boards are being used.  This mainly affects my Linux program that is sending temperature information to Boinctasks for display as a TThrottle temp.

From a windows system running tthrottle, with one each NVidia and ATI, your BT debug log shows the following:

<TThrottle><HN:JYSArea51><PV 7.72><AC 0><TC 41><TG 65><NV 1><NA 1><DC 100><DG 100><CT0 36.1><CT1 38.5><CT2 37.2><CT3 36.4><CT4 36.0><CT5 40.8><CT6 36.1><CT7 36.3><CT8 36.3><CT9 39.2><GT0 41.0><GT1 65.0><RSPJI3$0q><AA0><SC85><SG83><XC100><MC2><TX><TThrottle>


The temperature of 41.0 was the NVidia, the "<NV 1>"
The temperature of 65.0 is the ATI, the "<NA 1>"
I did not see anything for intel: was expecting an "<NI 0>" or something like that.

If my guess is correct, then if there are 6 nvidia and 3 ati then there should 9 values of: <GT 0>...<GT 8>
All preceded by <NV 6><NA 3>
However, that is just a guess as I was unable to observer multipole ATI temps on systems with NVidia board.
I then looked at a windows system that had an Intel GPU in addition to 6 ATI GPUs.

<TThrottle><HN:s9x00><PV 7.72><AC 0><TC 57><TG 59><NV 0><NA 6><DC 100><DG 100><CT0 58.3><CT1 59.6><CT2 58.0><CT3 58.9><GT0 52.0><GT1 59.0><GT2 59.0><GT3 59.0><GT4 59.0><GT5 59.0><RSSh)b+1m><AA0><SC79><SG97><XC100><MC2><TX><TThrottle>


The intel temperature is displayed by Boinctasks is 59.0 degrees from looking at the display.  I am guessing that value came from one of the GT1...GT5 since they are all 59.0.  I am guessing that, based on the Intel having the GPU incorporated in the CPU, the temperature should be closer to CT0 or any of CT0..CT3.  The last 5 video boards are all identical and all run identical work units so it is no surprise that 5 of the 6 are exactly 59.0

(1)  Question:  is the 59.0 displayed by BT from the CPU temps?  If so, then that is correct for imbedded Intel HD graphics.
However, CT0 shows 58.3, not 59 and I suspect that Intel temps comes from your <TG 59>, the maximum temp.  The Intel temp was associated with project collatz which supports intel and is labeled as "1INT".  The other projects were Milkyway and d0..d5 of "(ATIs)"

The brings me to the second problem: 
(2) What to have my Linux program send to BT to show temperatures when there are multiple NVidia, ATI and maybe a single Intel.  Boinc numbers coprocessors D0..Dn-1 for n NVidia and the same for AMD: D0..Dn-1.  I don't know of any intel co-processor boards that are GPUs so AFAICT there is only 1 Intel possible.

Currently, if a mixture of NVidia and ATI then I only bother to report the coprocessors that have the bigger count, as I do not know how to format the message to BT to properly identify the coprocessors.

Following shows temperatures from Linux systems running NVidia plus one Intel GPU tasks.  The wuprop tasks is displayed as it allows me to check the CPU temperatures.


Both systems run Ubuntu 18.04 as shown here
https://einsteinathome.org/host/12783910

Since BOINC does not keep track of the actual board name nor do they use the same D0..Dn-1 numbering as the Linux kernel, I had to come up with a translation table to display the correct temps adjacent to the actual D0..Dn-1 boards.

For the TB85 mining rig and NVidia only:

<devmap>
<Num_GPUs>6</Num_GPUs>
<1>0 5 01:00.0 NV GTX-1070</1>
<2>1 0 02:00.0 NV GTX-1660-Ti</2>
<3>2 1 03:00.0 NV P102-100</3>
<4>3 2 04:00.0 NV P102-100</4>
<5>4 3 05:00.0 NV P102-100</5>
<6>5 4 06:00.0 NV GTX-1070-Ti</6>
</devmap>


For the BTC110

<devmap>
<Num_GPUs>9</Num_GPUs>
<1>0 1 01:00.0 NV GTX-1060-6GB</1>
<2>1 3 02:00.0 NV GTX-1060-3GB</2>
<3>2 4 03:00.0 NV GTX-1060-3GB</3>
<4>3 2 04:00.0 NV P106-100</4>
<5>4 0 05:00.0 NV GTX-1070</5>
<6>5 8 08:00.0 NV P106-090</6>
<7>6 5 0A:00.0 NV GTX-1060-3GB</7>
<8>7 6 0B:00.0 NV GTX-1060-3GB</8>
<9>8 7 0E:00.0 NV GTX-1060-3GB</9>
</devmap>
#7
Occasionally a GPU gets hung and never finishes a job, or it can reject a job within seconds of receiving it.  These events are quickly discovered using the rules mechanism.  Currently, a batch file can be executed and an email or text message can easily be sent.  However, it would be advantageous to the project and the user, to be able to handle the situation automatically.  This can only be implemented if identifying parameters can be passed from BoincTasks to the handler.  At a minimum, the following parameters might be needed

$temp---------temperature of the device assuming tthrottle running or "none"
$device-------device id of GPU (D0, D1, etc) or just "CPU" if not a co-processor
$ip_address---need to know which system has problem
$port---------if needed to communicate with client and some systems have multiple clients
$password-----if needed to communicate with the client
$rule_name----the name of the rule could have an identifying phrase useful to the handler
$computer-----name of the system
$platform-----handler might need to know which OS: Linux, mac, windows
$project------name of project would be useful to handler
$app----------name of app
$rule_count---number of times rule has been applied

Example of rule usage

if Elapsed time > 5 minutes,  project "SETI@home",  app "8.01 setiathome_v8 (cuda90)", run program:
d:\ProgramData\boinc\scripts\HandleRule.bat $rule_name $ $ip_address $device

With these additions, more useful rules can be contributed as well as 3rd party scripts or apps such as resetting the GPU, excluding it from use by the Boinc client, or shutting down the client or system.

There is a discussion back in jan 2019 by Boinc principals here where they are considering adding xml files that basically duplicate a few of the BoincTasks rules.  Their xml includes, for example, instructions to a particular nvidia board to enable or disable.
This functionality is partially present in BoincTasks but is missing the parameters required to identify the device and system having the problem.  Even if their "Computing prefs 2.0" is implemented it would required those XML file to be present on each system.

The device_id can be 0, 1, 2 etc for each type of GPU so it must include a type such as nvidia, intel, amd, etc
Need to be consistent with naming used by the exclude_gpu which appear to be
  [<type>NVIDIA|ATI|intel_gpu</type>]
#8
Right click on a computer in the "All Computers" tree brings up a select list of apps to run.

Apps would be on a tab similar to "Extra" -> "BoincTask settings" -> "Messages"

Buttons such as ADD, DEL, TEST etc.

example of what might look like.  Instead of "Project" and "Message"
  "Name"                    "Command"
PuttyLinux            "C:\Program Files\PuTTY\putty.exe" username@$(IP_ADDRESS) -pw password
IssueMWUpdate          "D:\RUN_MW_RPC_APP.BAT" $(IP_ADDRESS) $(PORT) $(PASSWORD)

etc


The names would show up in the dropdown box
#9
Questions / need help making up a rule
August 24, 2019, 11:08:24 AM
This is a hardware or software problem but it would be nice if I could spot the problem when it first occurs.  Going to post over at BOINC also as possibly the problem could be debugged better if I knew more about what was happening.

---once every couple of days----

On a 5 GPU rig, one of the GPUs crunches for 4-5 seconds then goes on to another work unit.  A queue of "waiting to run" starts building up.  Because there are 4 other working GPUs. they pull from this queue so the queue grows only slowly.  After about an hour or two there might be 40 items in the queue.

sudo /etc/init.d/boinc-client restart  => does not always work
sudo shutdown now => looks like it works but I generally cycle the power after a few minutes of waiting

When the system boots back up I run a script to set the fans to %100 else temps get up past 80 for a pair of gtx1060

I failed to make a note of which GPU had the problem if indeed the problem is a single gpu.  The only way to tell is to stop the fan and see which one reports 0 speed and then look up the bus id and see which GPU it matches in coproc-info.xml.  Have not done this yet but will the next time this happens. It would be nice if BOINC reported the same GPU# that nvidia reports on their diagnostics.  BOINC assigned 0 to best (like 1070 or gtx 2080) and larger numbers to weaker GPUs.  Not sure why they bother to rank GPUs in the first place.

---back to the rule---

The most obvious thing is to see if there are more than X items in the "waiting to run" queue and then run a script that sends me a text message.  I already have a script that does that but there is no "waiting to run" and I am pretty sure the %cpu was 99 percent so I cant use that as a trigger.  However, the CPU% is always 99 because I need to run "-nobs" to force the system to dedicated a thread %1l00 to the GPU.  So possilbly the cpu is really idle and the 99 is simply a "busy polling all the time" symptom which is a feature of the "-nobs" parameter.
#10
I added a feature to compare GPU boards.  GRC mining frequently has a mining rack with 6 or more GPUs.

As shown below, There are 10 assorted nVidia boards recognized by BOINC.  The system TB85-nvidia is running the Linux app "cuda90" and shows 9351 work units completed successfully.  The "Type Analysis" shows the GPU option and the last 5.27 hours were analyzed and organized by GPU#.  Note that the gtx1070 Ti had the best performance with the GTX1060's slower.  The display is elapsed time in minutes.

Source to build the app (windows c#) and links to the executables as well as instructions for running the program are in the Boinctasks History Analyzer & Project performance post.  Feel free to email or PM me any questions, bugs, suggestions, etc.  I assume you can also post here.  I put a zip file with 32 and 64 bit executables here  This app uses dotnet framework 4.6.1 but I assume anything later could also be installed to allow it to run.


The following show how many credits were earned in the last 1.2 days.  Note that the system needs to be continuously mining in addition to boinctasks running constantly during the 1.2 days.


Added feature:  can plot wall time -vs- elapsed time to see changes in GPU performance.


All, or Individua,l GPUs can be scatter graphed to show differences in elapsed time. 


In addition, one can offset each GPU to see if there are differences in the processing of the data.
For example, the first graph shows a 5 GPU processing Milkyway datasets.  Once offset, it is
obvious that there are two different type of datasets some of which take longer to get the same
credits.

#11
I thought if I set "remove history after 2 days" and also "move to long term storage after 2 days" that I could save history files that have older data and would get (3*long) *2 days + 1 cvs worth of old and fresh data (7 days).  That didn't happened as it is not working like I guessed.

Looking at the help info here I see the recommended is after 7 days.  The files at \appdata\roaming\efmer\BoincTasks\history that are named "long" never seem to have anything in them other than headers.

With 2 and 7 days respectively it seems like I would lose 5 days of data after the 7th day but that does not happen as nothing gets into the "long" files.

I get cvs1 & cvs2 filling even though I have not checked "Make  a  backup ..... (not recommended)".

I did not see an explanation for that option.   Why is it not recommended?

Asking about this as my app "BTHistoryReader" is more useful if there is more data to analyze and I am losing data after 2 days and would like to have at least a weeks worth of data to analyze.
#12
Note sure if this is a real problem as I was easily able to fix it.  I do not know when it started, but I know only when I first noticed the problem (Jun 2)

I upgraded to BT 1.8 on May 28 and did not notice any problems but probably was not looking at temps.

This morning I look at BT and see a strange problem:  Temperatures for the CPU are way too low on a system that I know runs hot.  I reboot that system, same problem.  BT shows temps in low 30c which I know is wrong.  I go over to the system and bring up tthrottle to do a re-cal but I notice it shows temps in the mid 50c which is correct.  I got back to BT to see if I was looking at the wrong system but it is the correct one.  Exact tasks and details just the reported temperatures are not correct.  I Unchecked [X] from "computers" and then put it back in and the temperatures are correct. It was getting temps from somewhere else or was confused.
#13
Fred has graciously allowed my program BThistory to be promoted as an add-on to Boinctasks.
This post is frequently updated, please use your browser refresh feature to get changes and make
sure you have the latest build date as shown on main menu under the Open History button.
The location of the executables are listed  at the end of this post.   I put a zip file with 32 and 64 bit executables here
I do not have an install package for windows so you will have to answer a lot of "are you sure" questions from windows and your anti-virus when downloading or executing the app the first time.

BTHistory reads one or more Boinctasks's history files and allows data analysis for elapsed time, throughput and idle time.  If more than one file is opened, then comparisons can be made between different systems.  New or unknown applications are reported, highlighted and can be compared.  The program is written in C# and compiled under Visual Studio 2017.  One can download the executables or build the sources at location GitHub/JStateson.  Additional utility programs are included in the VS2017 solution and are explained below.  This app uses dotnet framework 4.6.1 but I assume anything later could also be installed to allow it to run.

1.   BTHistory main form and throughput analysis.


The history file "z400-4-s9x00" has been opened and there are 2 project names available. One has been selected (milkyway) and that project has only one app running on this system.  The number 5517 indicates the number of results.  A figure over 20,000 may take a while to load but that can be restricted to only ore recent results.  The throughput filter is selected and the last hours of data was fetched (no problems are shown in info window).  The continuity check was done indicating at most 1.48 minutes between results.  Knowing that this system had 4 boards, with 5 concurrent WUs and and average credit was 224 points, the results show about 5 credits per second per device.  The "1" adjacent to the App Name box indicates there is only 1 app associated with Milkyway, at least on this particular system.

2.   BTAhistory and Elapsed Time


Elapsed time is in minutes, but the plot parameters were changed to show the effective ET since four tasks were being run concurrently each GPU.  If there were 5 GPUs that mean of 50 seconds (as shown above) indicates the system with 5 GPUs will produce about (50 / 5 = 10 seconds per work unit)

2.1.   BThistory Idle Time


The Idle Time analysis is useful to show when projects run out of data or, as in the case above, the project fails to provide data until all the data has been processed.   In that case, where the system is waiting for data to arrive, the gap is considered idle time.  The above data shows that about every two hours there is a 6 to 9 minute gap before the server provides data.

2.2.  BThistory Dataset Scatter Plot


This graph can be used to observe how different data sets compare to one another in elapsed time.  Once a project is selected, then all the data sets can be displayed or any subset of them.  The application can also be changed to see how that compares.

2.3.  BThistory Dataset Member


Possible to find what dataset (name) the data belongs to by clicking on or near the point.  Restrictions: under 250 points and only 1 series


3.   BThistory Project Structure


This shows which projects are in the BThistory database or are in the history file

4.   BThistory Select Multiple Systems

If more than one history file is opened, then the BThistory produces a comparison of the different systems.  Typically the files of interest end in CVS and do not have phrase "_long_" in the filename.  In the event that the "long" files do contain data then you should uncheck that exclusion.


4.1   BThistory Comparison


This feature allows comparison of systems across the same project and app.  Currently only SELECT and REPORT are the only defined operations.  You can use this tool to compare, for example, the computation of SETI using NVidia  or AMD boards.  Once the project and app are selected only those systems will be shown.  Select (example above shows sse2) and the system you want to use in the comparison and click "save" to copy the results into notepad.  Then select the avx app and the system that is desired and you can examine the statistics and compare to what you saved in notepad.


4.2  BThistory Scatter Plots

There are two scatter plot options.  The first one compares Elapsed time  between the same applications.  This can show the difference between nVidia, ATI , sse2 or avx for example.


The second scatter plot shows only the selected app but each system is represented.  This shows how a particular app performs on different systems.


5   Other programs peripheral to BThistory

   The BThistory program resides at
https://github.com/JStateson/Gridcoin/tree/master/BTHistoryReader
The executables are stored in a .7z file at this GitHub location or you can obtain from my web site as
listed below

However, the actual VS2017 solution is at GitHub/JStateson/GridCoin which will cause one or more of the following programs to be built in addition to BTHistory.   All programs listed were built using VS2017 C# except for the RPC library, in C, which is only used by BoincRpc.

5.1  HostProjectStats

The is an aspx program that creates a web page.   It can be compiled and executed on your windows system or you can run the program using most browsers by clicking on the link below
http://stateson.net/HostProjectStats

This program obtains elapsed time information from most Boinc Projects and, if you optionally know the load and idle wattage, it will calculate the average credit and wattage used to produce those credits for the system and the boards.  This program requires that the data be available so it may not work with anonymous access unless the project had allowed it for the specified HOSTID.

As shown below, the project Milkyway has been browsed to and hostID 705276 selected.  This is one of the top systems and is listed by default when first bringing up the program.  It may not always be available.


Inexpensive watt meters are available, but you can build your own as shown

Here

https://github.com/JStateson/Gridcoin/blob/master/HostProjectStats/wmeter_wiring.jpg

and assembled here

https://github.com/JStateson/Gridcoin/blob/master/HostProjectStats/wmeter_assembled.jpg

Full load results of a pair of GPUs running 4 concurrent threads are shown here
https://github.com/JStateson/Gridcoin/blob/master/HostProjectStats/e5620_s9000_milkyway_4t_load.png

   HostProjectStats produced the following results based on the above data
https://github.com/JStateson/Gridcoin/blob/master/HostProjectStats/e5620_s9000_milkyway_4t.png


The 32 and 64 bit executables here I do not have an install package so it may not run unless you got the latest visual c run-times and dot net modules and windows 10.   Visual studio 2017 is a free download and has all the stuff needed to build this program.  PM me if a problem.
#14
Wish List / test for out of work
April 25, 2019, 01:28:45 AM
Would like to know when there are no work units left along with a parameter such as time elapsed since queue was empty.  Currently there is a problem being discussed at milkyway where fast computers complete too soon and ask too often so they get banned and end up not getting any work until a manual update is issued.  Maybe the problem can be fixed at their end, no telling when though.

I would use the rule to issue a manual update and the rule would then be disabled and only re-enabled if more work actually arrived.

some projects go offline for maintenance but  I have %shares set to allow other projects to start.  The problem is fast systems getting "banned" and then needing an update to get more work.

Obviously this is a problem on the project server, but you might consider adding a rule to cover this.

[EDIT] Looks like there is a fix on the server side as discussed HERE.  Not the same fix as the topic suggests as one fix requires another as is usual.
#15
Not sure why David did that.  From BoincTasks I select the BOINC website to get to the forum or to check for latest updates.  After getting redirected it is a PITA to find those sites.

[EDIT]  After I asked about this at the boinc Q&A forum they fixed the redirect.  It now goes where it always went.  Hopefully they wont change it again.
#16
Questions / ATI detection problem observation and fix
February 08, 2018, 02:58:56 PM
After editing TThrottle.xml to get the order of my pair of HD-7950s temperatures to correspond, I decided to swap cards in respective pcie slots.  Unaccountably, I lost the temperatures for one of the cards.  The outer card was having its temperature reported for the card closet to the CPU.  The card closest was not being reported at all.  On a hunch, I pulled the HDMI dongle (dummy load) off the outer card and put it on the inner one and that fixed the problem after a reboot.  That is probably the problem I have on another ATI system that is not connected to any monitor.  I need to put an HDMI load on the "primary" card to force the driver to set an order. I am just guessing but clearly having a monitor or dummy load connected to an ATI card makes a difference in how the temperature is reported.  I have not seen this on nVidia cards on some of my headless systems with no dummy load or monitor.
#17
Beta Testing / B.T. 1.75
January 30, 2018, 01:45:36 AM
[EDIT] - HMM--cannot do an attachment.  Dont see any way under Chrome.  I will put on my website
http://stateson.net/rules.zip maybe someone can tell me how to add a zip file attachment.

I need to implement a rule and I first tried 1.73 then the beta.  I was successful in implementing two somewhat similar rules, but there was a problem (bug) that I would like to report and also a feature request.

Some history:  Occasionally, one or another of my systems gets an nVidia or ATI kernel error and recovers usually immediately with no bad effects.  Unfortunately, one of my video board, an HD7950 occasionally does not recover.  I discovered that simply suspending and resuming any project on that board will fix the problem.  A sleep command for 10 seconds works fine and is easy to implement at the win10x64 command prompt with "boinccmd --set_gpu_mode never 10".  I thought I would implement a rule to do this for me.  This board processes MilkyWay tasks that take no more than 3 minutes.  At 5 minutes elapsed time there must be a real problem so I based my rule on MilkyWay.  I installed boinctasks on that system, made sure that history was enabled and configured and tested the rule which worked (after some time tinkering of course).  Attached to this post is a zip that contains the rule, and two command files.  One FixGPU.bat causes boinc to sleep, the other, CallMe.vbs sends me a text message about the problem and is called by FixGPU.

All seemed to be fine until I decided I wanted to do this from my main desktop system and not have boinctasks run on the dedicated boinc research system.  I ran to two problems.

1.  Feature request:  It is not possible to run a local program and also issue a sleep command to a remote system.  The bottom right corner box is where the sleep parameter goes.  That is the same box that is supposed to have the path to the program that I wanted to run so as to send a text message to my cell.

2.  Both 1.73 and 1.75 improperly handle the sleep parameter.  Where the rules.xml file has <ivalue0>300</ivalue0> that puts "00d,00:05:00" into the dialog box "value" which is correct.  I used 5 seconds for the time for the 5 minute MilkyWay threshold and I put 10 into the bottom right corner box.  Unaccountably, when clicking on "check" the 5 minutes is changed to 10 seconds.  One or more of the fields in the dialog box are accessed improperly.  After "OK" and exiting, if one does a file compare of the rules.xml with a backup you can spot that the 300 seconds was changed to 10 seconds which is incorrect.  I have tested my rules.xml file and it works but you must edit it to put in "yes" to activated it because if you ever bring it up in the rules editor dialog box it will get corrupted.  I am including two pictures that demonstrate the problem.

Here is my working rules.xml file

    <rules>
    <rule>
        <active>yes</active>
        <name>7950</name>
        <computer>z400-3-RX570</computer>
        <project>Milkyway@Home</project>
        <appliation>1.46%20MilkyWay@Home%20(opencl_ati_101)</appliation>
        <type0>5</type0>
        <type1>0</type1>
        <type2>0</type2>
        <operator0>2</operator0>
        <operator1>0</operator1>
        <operator2>0</operator2>
        <ivalue0>300</ivalue0>
        <ivalue1>-1</ivalue1>
        <ivalue2>-1</ivalue2>
        <dvalue0>0.000000</dvalue0>
        <dvalue1>-1.000000</dvalue1>
        <dvalue2>-1.000000</dvalue2>
        <itime>5</itime>
        <color>6569215</color>
        <event_show>1</event_show>
        <event_internal>7</event_internal>
        <event_external>0</event_external>
        <event_parameters>10</event_parameters>
    </rule>
    </rules>

This is what happens if it is brought up in the rules dialog box.  The file compare is under it.  Note that the 5 minutes was changed to 10 seconds.


#18
Questions / Wrong temp for 2nd ATI video board
January 18, 2018, 10:51:02 PM
I made that change in tthrottle.xml to get my second HD-7950 recognized but I have the same problem as my other pair of HD-7850.  The 2nd video boards temperature is not reported:  Instead, the first boards temperature is reported in its place.  By "first board" I mean the ATI board that is furthermost from the CPU.  Unfortunately, the one closest to the CPU always seems to run hotter and if that was reported "twice" I would be happy as I know the other one is always cooler (unless the fan stops of course).

Anyway, I can get the 2nd board's temp using Radeon software's overclock option or through gpu-z but neither of those programs report back to boinctasks.  Lemme know if I can help debug this.

Thanks for looking!

[EDIT] I also tried using 2 and then 1 for "inactive" but both of those options caused crashes and setting that ATI "inactive" to 0 stopped the crashes.
#19
Wish List / Tjunction values for various CPUs
October 24, 2017, 04:09:04 AM
I replaced a Q6600 (2.4ghz socket 775) with a Xeon X5470  (3.33ghz socket 771) and the displayed temps were almost 15deg higher than actual.  Looking around, I found this list of Tj Max values for various Intel CPUs:
https://forums.overclockers.co.uk/threads/official-tjmax-figures.17936945
X54xx was 85 deg and when I put that value into TThrottle's tjunction setting the displayed temperatures dropped to where they matched AIDA64 and SpeedFan.

There might be a better list somewhere else, but the change from 100 to 85 allowed all BOINC tasks on my MS-7380 motherboard to run at full speed.

HTH someone!
#20
Wish List / GPU number to match that in BOINC
February 05, 2013, 05:25:02 PM
The GPUs ID number does not match that reported by boinc on the boinctasks program.  For example, the following LOG from tthrottle does not list an ID. 
    nvidia: found 3 logical devices
    nvidia: found 3 physical devices
    nvidia: Temperature 66 °C, max Temperature 127 °C
    nvidia: Temperature 58 °C, max Temperature 127 °C
    nvidia: Temperature 52 °C, max Temperature 127 °C

    nvidia: GeForce GTS 250, GeForce GTS 250, GeForce GTX 650 Ti

The following screen shot shows the temperature display from tthrottle


I am guessing that the ID numbers in the above log should correlate to 2,1,0 since the message log (boinc) shows the following


    2/6/2012 9:46:08 PM |  | NVIDIA GPU 0: GeForce GTX 650 Ti (driver version 310.90, CUDA version 5.0, compute capability 3.0, 1024MB, 8381368MB available, 1425 GFLOPS peak)
    2/6/2012 9:46:08 PM |  | NVIDIA GPU 1: GeForce GTS 250 (driver version 310.90, CUDA version 5.0, compute capability 1.1, 1024MB, 974MB available, 705 GFLOPS peak)
    2/6/2012 9:46:08 PM |  | NVIDIA GPU 2: GeForce GTS 250 (driver version 310.90, CUDA version 5.0, compute capability 1.1, 1024MB, 950MB available, 705 GFLOPS peak)

I wish that the log in tthrottle show the same GPU ID number that BOINC shows.  The reason for this is that I restrict some GPU's from crunching certain projects because some overheat.  Yesterday, I had a gts250 up at 92c on primegrid.  This one, with the high temperature, was in the middle of 3 PCIe slots and does not get enough air even with eVga precision 3.04 setting the fan at %100.  It runs just fine on collatz, poem, and other projects that use opencl.  However, primegrid easily overtaxes this board and I would  have to set the gpu and memory clocks down to minimum to prevent overheating.  It is easier just to exclude the gpu from processing.  To do that, I need to know the device number that boinc uses. 

Put this down at low priority because boinctasks does show the temperature and the device (gpu) number.  However, I do not always have boinctasks available and if you have only tthrottle and boincmgr then there seems no way to properly id the gpu.   Obviously, this affects only those systems with more than 1 gpu.