Sorry, I cut off the image.
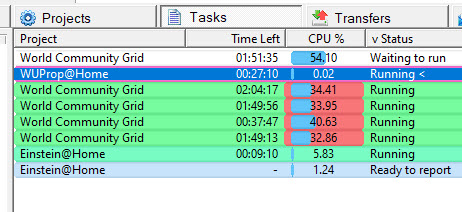
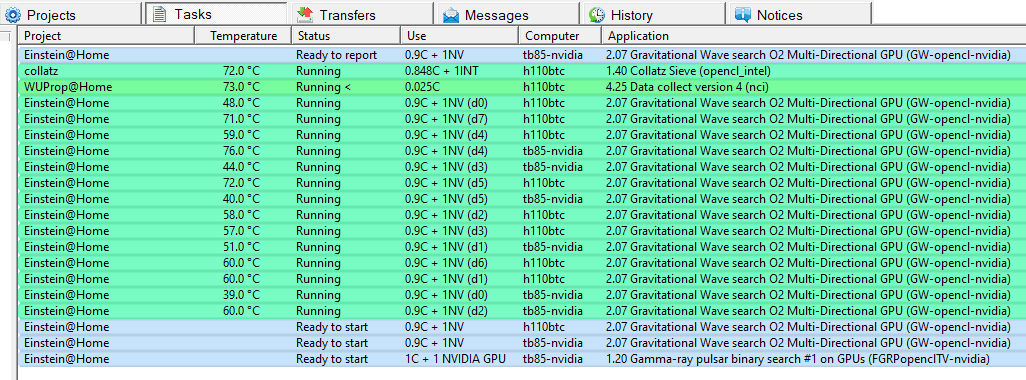
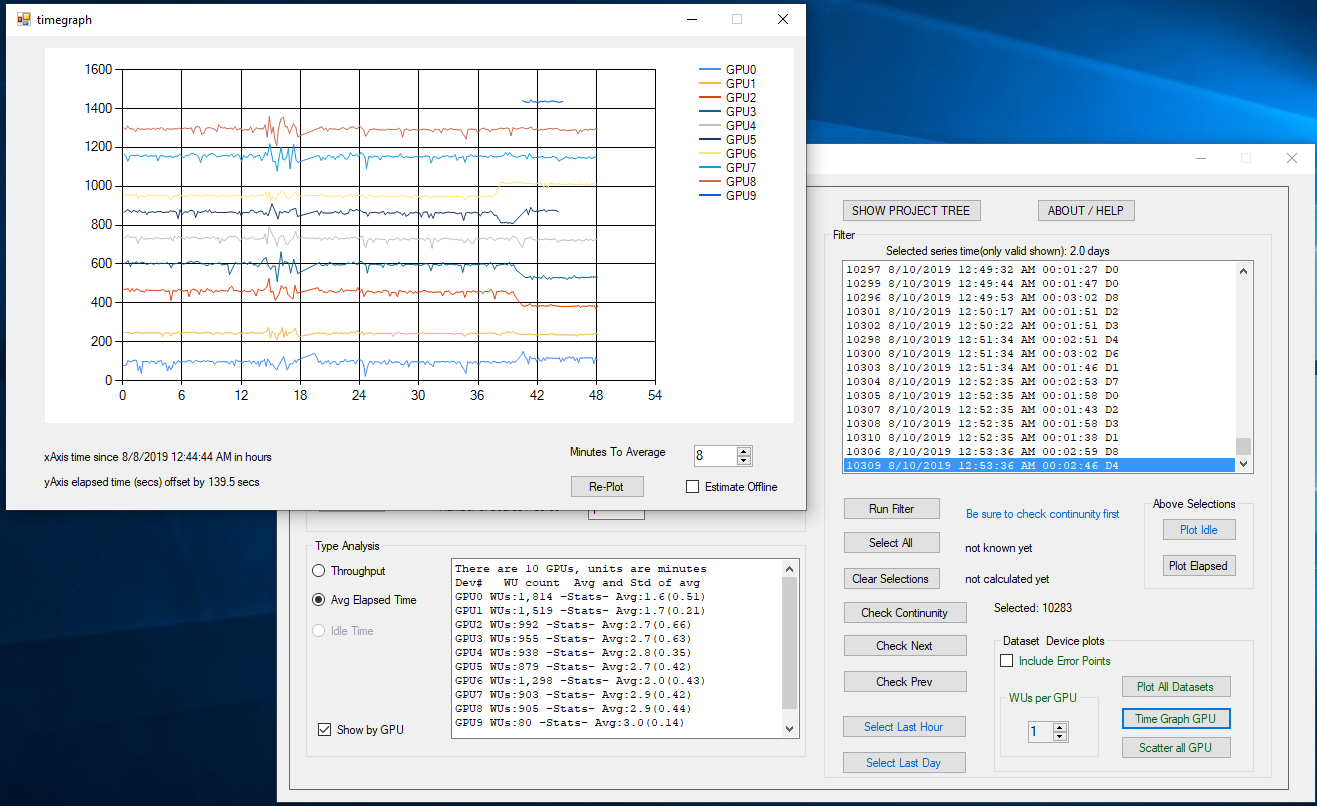
All those tasks in red are CPU only tasks, no GPU. Most are now in the 20%
I have never seen CPU tasks that low
CPU time percent is set to %100
windows 11, CPU has 20 threads.
Just noticed something - I disabled GPU usage and all the CPU power levels are slowly increasing.
Went up and back down, just varying about %20 <-> %60 but should be at %99.
Going to swap the 3070 out for a 1660 and see if the problem disappears.
Will run enough CPU work units to see if the run time is really different depending on which graphics board is used.
going to run some tests using cosmology home and compare to other systems then swap out the graphics board.
All those tasks in red are CPU only tasks, no GPU. Most are now in the 20%
I have never seen CPU tasks that low
CPU time percent is set to %100
windows 11, CPU has 20 threads.
Went up and back down, just varying about %20 <-> %60 but should be at %99.
Going to swap the 3070 out for a 1660 and see if the problem disappears.
Will run enough CPU work units to see if the run time is really different depending on which graphics board is used.
going to run some tests using cosmology home and compare to other systems then swap out the graphics board.